Multiple variables in the same scatter plot

HELLO,
Here, is another simple but very cool grapch R can create quickly. I find it the easiest way to create scatter plots especailly when I have to present two dependent variables with only one x-variable. I think this is not easily obtained EXCEL which we mostly use to obtain quick plots. But grahics is R's another speciality.
Here is how we can make a scatter plot with two dependent variables in it.

#Lets create the variables first. I am adding some noise to both dependent variable to make the plot look pretier.

x<-1:100
y<-x + sqrt(sample(x))
z<-x - sqrt(sample(x))

#plot x vs y

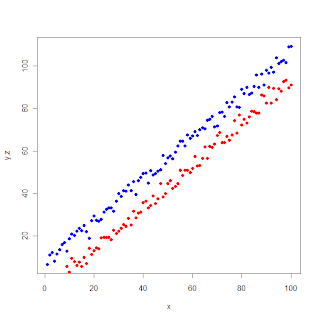
plot(x,y, col = 'blue',pch = 16,xlab = 'x', ylab = 'y,z')

#Now to add the plot of x vs z in the same graph,

points(x,z, col = 'red', pch = 16)

The output will look like this

But this picture doesn't tell us which is y and which is z. But we can easily add a legend to this with legend() command

legend(10,85,legend = c("y","z"), col = c("blue", "red"),pch = 16)

# here 10, and 85 are the xy-coordinates where the legend-box will be added on the graph.


Now the graph is complete
.


Isn't this easy and quick? That's why I am a fan of it.


Article about R in NYTimes


I was just browsing the net and found an interesting and very good article in NYtimes.

I am touched by the first sentence. R could be just 18th letter of English alphabet ………………., that’s exactly what happened many times when I mentioned R in some friends circle.

Data accessing, editing and Manipulation


lets create some vectors,

   1: Var1<-c(1,2,3,1,2,4,5,0,2,6,8,5,3,7,5,2,8,9,2,10)
   2: Var2<-rep(c(1,2,3,4) each=5)
   3: Var3<-rep(1:5, 4)

now, lets make a data frame


   1: > datalist<-data.frame(Var1, Var2, Var3)


   Var1 Var2 Var3
1     1    1    1
2     2    1    2
3     3    1    3
4     1    1    4
5     2    1    5
6     4    2    1
7     5    2    2
8     0    2    3
9     2    2    4
10    6    2    5
11    8    3    1
12    5    3    2
13    3    3    3
14    7    3    4
15    5    3    5
16    2    4    1
17    8    4    2
18    9    4    3
19    2    4    4
20   10    4    5

so, the variable names can be changed now with,


> names(datalist)<-c("X", "Y", "Z")

Data Access:


> datalist[1:4,]


  X Y Z
1 1 1 1
2 2 1 2
3 3 1 3
4 1 1 4


> datalist[1:3,1:3]


  X Y Z
1 1 1 1
2 2 1 2
3 3 1 3


> datalist[3,3]


[1] 3


> datalist$X[c(2,5,8)]

[1] 2 2 0


> datalist$X[-c(2,5,8)]

[1]  1  3  1  4  5  2  6  8  5  3  7  5  2  8  9  2 10


> datalist[c(2,5,8),c(1,2)]

  X Y
2 2 1
5 2 1
8 0 2


Note that, X variable can not be accessed directly and we used datalist$X , if we want to access X directly we can use attach() function


> X
Error: object "X" not found
> attach(datalist)
> X
 [1]  1  2  3  1  2  4  5  0  2  6  8  5  3  7  5  2  8  9  2 10

Generating treatment maps for a typical CRD experiment

Hellooo! 

For the last couple of weeks, I have been learning to write some R functions for simple biological systems simulations. Well, I haven't been that successful in that venture, but I surely learned some pretty useful things that we can do in  R w/o spending much time and brain.

Generating  the plot map in a completely randomized desine.

I think experimental designs are the inextricably related with most agricultural studies.  So, at least for me, knowing this code will make my work a bit easier in future.

Here is a code that generates a randomized treatment map for a CRD experiment

> no.treat<- ntrt<- 6
> no.repln<- nrepl<- 4
> trt.samples<- sample(rep(x = 1:no.treat, times = no.repln))
# This will generate random sampls for all the 6 treatments and repeat this for all the 6 replications.
> trt.map<- matrix(trt.samples, nrow = no.repln, ncol = no.treat)
# This will create a matrix of the random samples which is also the plot map of the experiment.
which looks like as follows
> trt.map
     [,1] [,2] [,3] [,4] [,5] [,6]
[1,]    5    1    6    6    5    3
[2,]    2    3    6    2    4    4
[3,]    4    3    2    1    2    5
[4,]    4    1    6    5    1    3
This is pretty easy, isn't it.