

HELLO,
Here, is another simple but very cool grapch R can create quickly. I find it the easiest way to create scatter plots especailly when I have to present two dependent variables with only one x-variable. I think this is not easily obtained EXCEL which we mostly use to obtain quick plots. But grahics is R's another speciality. Here is how we can make a scatter plot with two dependent variables in it.
#Lets create the variables first. I am adding some noise to both dependent variable to make the plot look pretier.
x<-1:100
y<-x + sqrt(sample(x))
z<-x - sqrt(sample(x))
#plot x vs y
plot(x,y, col = 'blue',pch = 16,xlab = 'x', ylab = 'y,z')
#Now to add the plot of x vs z in the same graph,
points(x,z, col = 'red', pch = 16)
The output will look like this
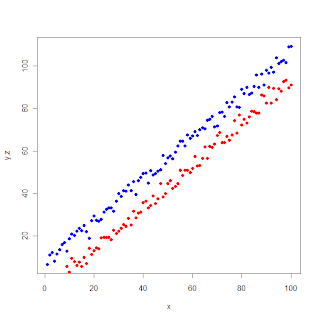
But this picture doesn't tell us which is y and which is z. But we can easily add a legend to this with legend() command
legend(10,85,legend = c("y","z"), col = c("blue", "red"),pch = 16)
legend(10,85,legend = c("y","z"), col = c("blue", "red"),pch = 16)
# here 10, and 85 are the xy-coordinates where the legend-box will be added on the graph.
Now the graph is complete.

Isn't this easy and quick? That's why I am a fan of it.
2 comments:
@Subodh: I believe the same thing can be done even with Excel.
Anyways, I have a query:
If we have a vector x containing, say 30 elements while y contains only 15 elements. How to plot y vs x taking the first 15 elements of x ?
well said, but do you know how to apply the same command to generate many plots say 1000 scatter plots with 2 dependent variables? i have tried using the for loop but the second variable is only added to the last plot
pdf("C:/Users/")
par(mfrow=c(2,3))
for(i in seq(1, length(Set),1) )
plot(Set$Tm.slope,Set[,i],xlab="Tm.slope",ylab=names(Set[i]),type="p",col="red",ylim=c(-0.05,50),xlim=c(0,2))
for(i in seq(1, length(Set),1) )
points(Set$Fib.slope,Set[,i],col="blue")
dev.off()
Post a Comment