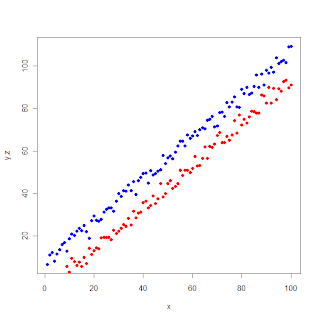
legend(10,85,legend = c("y","z"), col = c("blue", "red"),pch = 16)
# here 10, and 85 are the xy-coordinates where the legend-box will be added on the graph.
Now the graph is complete.

Saturday, February 21, 2009
I was just browsing the net and found an interesting and very good article in NYtimes.
I am touched by the first sentence. R could be just 18th letter of English alphabet ………………., that’s exactly what happened many times when I mentioned R in some friends circle.
Wednesday, February 11, 2009
lets create some vectors,
1: Var1<-c(1,2,3,1,2,4,5,0,2,6,8,5,3,7,5,2,8,9,2,10) 2: Var2<-rep(c(1,2,3,4) each=5) 3: Var3<-rep(1:5, 4)now, lets make a data frame
1: > datalist<-data.frame(Var1, Var2, Var3)
Var1 Var2 Var3
1 1 1 1
2 2 1 2
3 3 1 3
4 1 1 4
5 2 1 5
6 4 2 1
7 5 2 2
8 0 2 3
9 2 2 4
10 6 2 5
11 8 3 1
12 5 3 2
13 3 3 3
14 7 3 4
15 5 3 5
16 2 4 1
17 8 4 2
18 9 4 3
19 2 4 4
20 10 4 5
so, the variable names can be changed now with,
> names(datalist)<-c("X", "Y", "Z")
Data Access:
> datalist[1:4,]
X Y Z
1 1 1 1
2 2 1 2
3 3 1 3
4 1 1 4
> datalist[1:3,1:3]
X Y Z
1 1 1 1
2 2 1 2
3 3 1 3
> datalist[3,3]
[1] 3
> datalist$X[c(2,5,8)]
[1] 2 2 0
> datalist$X[-c(2,5,8)]
[1] 1 3 1 4 5 2 6 8 5 3 7 5 2 8 9 2 10
> datalist[c(2,5,8),c(1,2)]
X Y
2 2 1
5 2 1
8 0 2
Note that, X variable can not be accessed directly and we used datalist$X , if we want to access X directly we can use attach() function
> X
Error: object "X" not found
> attach(datalist)
> X
[1] 1 2 3 1 2 4 5 0 2 6 8 5 3 7 5 2 8 9 2 10
Tuesday, February 10, 2009
Hellooo!
Saturday, February 7, 2009
Design of ThaSlayer | To Blogger by Blog and Web